支招小作文 I 混合数据图 英国移民居住时间 & 移民原因
雅思学习,今天分享的是“支招小作文 I 混合数据图 英国移民居住时间 & 移民原因”。
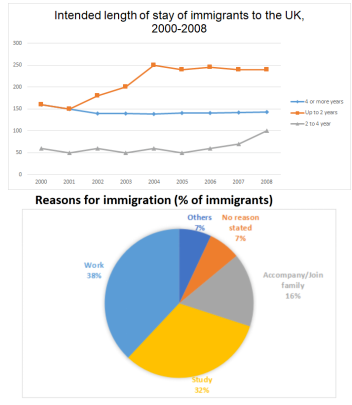
The line graph and pie charts below show the number of three groups of immigrants from 2000 to 2008 and the percentage of immigrants for different reasons in 2008.
【主体段分段】:按照图分段
Body 1:线图
Body 2:饼图
【开头段】
The line graph illustrates how long immigrants intended to stay in Britain between 2000 and 2008, and the pie chart compares different reasons for immigration for the year 2008.
【概述段】
It is clear that among all the three surveyed groups, more people chose to spend no more than 2 years in UK. Also, work and study were the primary reasons for migration to this country.
思路要点:
- 线图:up to 2 years的人数一直
- 饼图:work和study的占比较大
【Body 1】
According to the line chart, we can find that originally, roughly 160,000 immigrants decided to stay in UK for up to 2 years. After a slight drop by 10,000 in the subsequent year, this figure soared to its peak at 250,000 in 2004. The following 4 years witnessed a period of steadiness in this figure. The number of people choosing to stay in UK between 2 and 4 years fluctuated at around 50,000 in the initial 5-year period, after which this figure nearly doubled in 2008. Besides, although no surveyed people opted for a stay of at least 4 years before 2001, we can see that 150,000 people made such decision in 2001 and this figure remained constant until the end of the given period.
思路要点:线图
- 橙色:年160,000→2001年小幅度下降→2004年急剧上升到峰值→到2008年平稳
- 灰色:2000~2005年波动在大约50,000→到2008年上涨2倍数
- 蓝色:2001年前无数据→2001年数据为150,000→直到2008年平稳
【Body 2】
In terms of factors that attracted people to reside in UK, it is obvious that work was considered by 38% of the surveyed people. Also, 32% of the immigrants chose to live in this country for study, and this figure was twice as large as the percentage of people moving to this country for family reasons. Furthermore, both people migrating to UK for unclear and other reasons accounted for 7% respectively.
思路要点:饼图
- work数据为38%
- study数据为32%,是accompany/join family的2倍
- no reason stated和others都占比7%
以上仅供参考,详情可咨询新航道石家庄学校,小航在这里等你。
免责声明:
1、如转载本网原创文章,请表明出处; 2、本网转载媒体稿件旨在传播更多有益信息,并不代表同意该观点,本网不承担稿件侵权行为的连带责任; 3、如本网转载稿、资料分享涉及版权等问题,请作者见稿后速与新航道石家庄学校联系(电话:400-0311-689), 我们会第一时间删除。
推荐阅读
【本文标签】:
【责任编辑】:邯郸新航道小编 版权所有:转载请注明出处